Global trade depends on container transport that is predictable, visible, and resilient. UNCTAD’s Review of Maritime Transport 2024 reports that maritime trade reached approximately 12.3 billion tonnes in 2023. Containerized cargo remains central to manufactured goods, retail inventory, machinery, and temperature-sensitive products. Yet capacity alone does not define a strong transport company.
This 2026 guide evaluates leading container transport companies through practical buyer concerns. These include global port coverage, sailing frequency, schedule reliability, equipment availability, digital tracking, documentation support, and cargo-claims procedures. The World Bank’s Container Port Performance Index 2023 shows significant differences in port efficiency worldwide. Those differences can affect inland delivery, storage costs, and production schedules. Small delays matter.
Data from the UNCTAD report also highlights continuing pressure from vessel rerouting, congestion risks, and changing freight capacity. Drewry’s World Container Index provides another useful market reference, although spot prices can change sharply by route and week. Buyers should therefore compare service performance, not only advertised rates. A low quote may become expensive after demurrage, missed connections, or repeated transshipment.
This ranking is a practical starting point, not a permanent verdict. A moving target. Carrier performance can vary between Asia–Europe, Transpacific, and regional lanes. Information quality also differs across public reports, carrier disclosures, and customer experience. We have considered those limitations while identifying companies with broad networks, measurable operational strengths, and dependable buyer support. Readers should still verify current schedules, contracts, insurance terms, and destination charges before booking. Reliability is earned shipment by shipment.
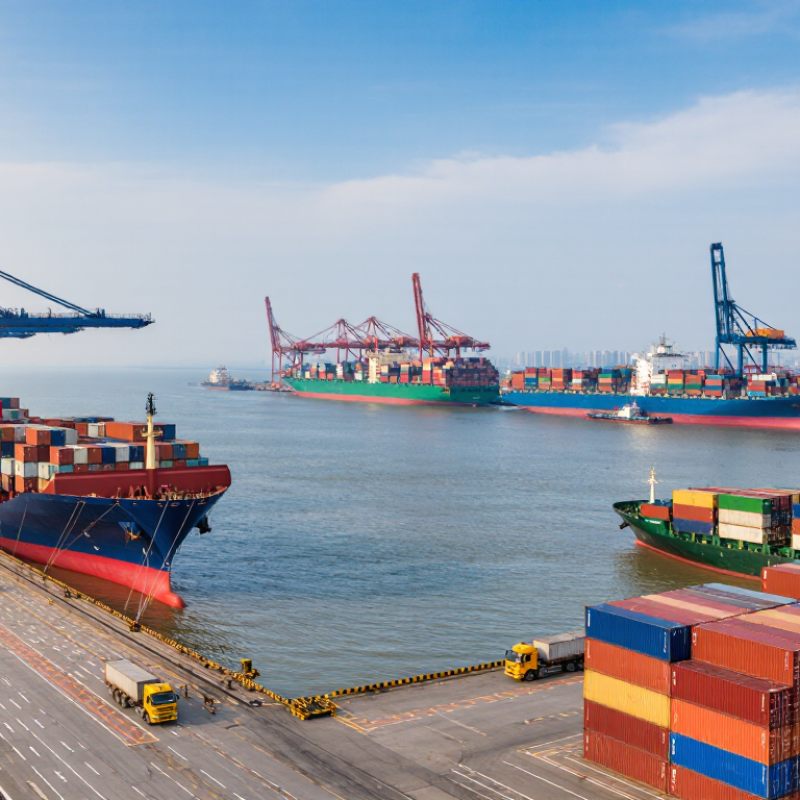
Container transport remains the backbone of international merchandise trade. UNCTAD’s Review of Maritime Transport 2024 reported 2.4% growth in maritime trade during 2023. Nearly 80% of global trade by volume still moves by sea. For buyers, this means freight capacity remains essential, but not always predictable. A container may wait outside a busy port, then move quickly through another.
Capacity is expanding, yet operational pressure continues. UNCTAD reported that the global commercial fleet grew in 2023, while geopolitical disruptions forced longer routes and higher fuel consumption. These changes affect transit times, equipment availability, and insurance costs. Buyers should compare actual schedule reliability, not only advertised sailing times. A delayed forty-foot container can also interrupt warehouse labor, production planning, and retail launches.
The World Bank’s Logistics Performance Index 2023 shows wide differences in customs efficiency, infrastructure, and shipment timeliness between economies. That gap matters in 2026. Strong container transport partners should provide milestone tracking, documented handoffs, realistic booking windows, and clear surcharge terms. They should also explain contingency plans for port congestion and missed connections. Small details matter. A practical shipment review should check cut-off times, container condition records, free-time limits, and inland delivery appointments. Data reports offer direction, but they cannot remove uncertainty. Forecasts can still be wrong.
2026 Top Container Transport Companies for Global Buyers
Key Criteria for Evaluating Container Transport Companies
Choosing a container transport company requires more than comparing ocean freight rates. UNCTAD’s Review of Maritime Transport 2024 states that shipping carries over 80% of global merchandise trade by volume. A small delay can therefore affect factory schedules, inventory, and customer commitments.
Schedule reliability should be measured with recent route-level data, not broad promises. The Sea-Intelligence Global Liner Performance Report tracks on-time arrivals and delay averages across major services. Ask for the last six months of performance. Look for clear explanations when results fall. Perfect reliability is unrealistic.
Port efficiency also matters. The World Bank and S&P Global’s 2023 Container Port Performance Index examined over 182,000 vessel calls across 405 ports. Its data highlights how port time can influence the entire transport chain. Evaluate average dwell time, transshipment exposure, equipment availability, and inland connections. A low ocean quote may become expensive after storage, chassis, or rail delays.
Experienced buyers should also test shipment visibility. Can the provider show container milestones, exception alerts, and documented claims procedures? Check whether quoted costs include handling, documentation, security, and possible congestion charges. Sustainability data deserves scrutiny too. Request emissions methods and shipment-level calculations, rather than vague environmental language. The weakest area is often contingency planning. A capable provider should explain alternative ports, routes, and equipment options before disruption occurs. Even detailed scorecards need review; operational reality can change faster than the data.
| Evaluation Dimension | Recommended Weight | Buyer Benchmark for 2026 | Data to Request | Why It Matters |
|---|---|---|---|---|
| Global Route Coverage | 12% | Service available across the buyer's origin, destination, and inland delivery locations | Port pairs, inland corridors, service frequency, transshipment points, and local operating licenses | Coverage determines whether one transport partner can manage the complete container journey. |
| Schedule Reliability | 15% | At least 85% on-time performance against the agreed arrival window | Monthly on-time pickup, port departure, port arrival, and final-delivery statistics for the previous 12 months | Reliable schedules reduce production interruptions, inventory shortages, and missed delivery appointments. |
| Transit-Time Consistency | 10% | Published transit time plus a clearly defined variance allowance | Average, fastest, slowest, and 95th-percentile transit times by route | A consistent transit time is often more valuable than the shortest advertised transit time. |
| Total Landed Transport Cost | 15% | A transparent all-in quotation with no unexplained accessorial charges | Ocean or line-haul rate, fuel surcharge, terminal fees, documentation fees, customs charges, storage, demurrage, and detention terms | Comparing the complete cost prevents low headline rates from becoming expensive final invoices. |
| Equipment Availability | 10% | Documented access to the required container type during peak and off-peak seasons | Equipment allocation policy, dry-container availability, refrigerated-container availability, and substitution procedures | Equipment shortages can delay loading even when vessel or truck capacity is available. |
| Digital Tracking and Visibility | 10% | Event-level tracking from booking confirmation through proof of delivery | Tracking events, estimated-time updates, exception alerts, API or EDI options, and data-retention policy | Accurate visibility helps buyers manage inventory, customer communication, and disruption response. |
| Customs and Documentation Capability | 8% | Document review before cargo cut-off and a defined process for customs exceptions | Commercial invoice requirements, packing-list standards, bill-of-lading process, customs support, and document error rates | Correct documentation reduces clearance delays, storage costs, and compliance exposure. |
| Cargo Security and Loss Prevention | 8% | Written security procedures covering custody transfers, seals, yards, and incident escalation | Security certifications, seal-control process, incident statistics, cargo-screening procedures, and claims history | Strong controls reduce theft, tampering, misrouting, and unauthorized access to cargo. |
| Damage and Claims Performance | 5% | Clearly defined claims process with response deadlines and documented resolution data | Damage ratio, loss ratio, average claim-resolution time, liability limits, and cargo-insurance options | Claims performance indicates how effectively the provider protects cargo and resolves problems. |
| Sustainability and Emissions Reporting | 5% | Shipment-level or lane-level emissions data using a documented calculation method | Carbon-reporting methodology, emissions factors, low-emission transport options, and environmental certificates | Verifiable emissions data supports supplier reporting, regulatory needs, and corporate climate targets. |
| Operational Resilience | 7% | A documented contingency plan for port closures, labor disruptions, severe weather, and equipment shortages | Alternative routes, backup facilities, escalation contacts, business-continuity plans, and disruption-notification procedures | Resilience limits the commercial impact of unavoidable transport disruptions. |
| Customer Support and Escalation | 5% | Named account management, regional support, and 24-hour escalation for active international shipments | Support hours, response-time commitments, escalation levels, language coverage, and service-review schedule | Fast communication is essential when containers are delayed, held, damaged, or rerouted. |
For global buyers, leading container transport companies in 2026 are judged by more than vessel space. Reliable providers combine schedule discipline, port coverage, shipment visibility, and responsive support. Their teams should explain routing choices clearly, especially when transshipment adds days. A practical test is simple: request a sample booking timeline, milestone updates, and exception procedures. If answers remain vague, risk is already visible. Experience matters here. Experienced operators know that a quiet tracking screen does not always mean smooth cargo movement.
Strong companies also build dependable inland connections. They coordinate terminals, customs documentation, warehouses, and final delivery without hiding handoff gaps. Buyers should review on-time performance, equipment availability, claims handling, and communication records. Independent certifications and audited service data can support credibility, but they are not perfect proof. Ask for recent trade-lane references and measurable service commitments. Real expertise appears in details, such as how quickly a damaged seal or rolled booking is reported. Small details matter.
Tips: Compare total landed cost, not only the ocean rate. Confirm free-time terms, surcharge rules, insurance responsibilities, and escalation contacts before signing. Keep written records of every change. A monthly review can expose repeated delays or weak communication. I would also test one route before expanding the relationship. That cautious step may feel slower, yet it often reveals operational weaknesses early. No provider performs perfectly, so buyers should value honest reporting over polished promises.
For global buyers in 2026, container transport should be judged by service coverage, not price alone. UNCTAD’s Review of Maritime Transport reported 2.4% growth in maritime trade during 2023. However, route disruptions still create schedule uncertainty and extra surcharges. Compare port pairs, sailing frequency, inland delivery, and customs support before accepting a quote. A low ocean rate may exclude documentation, terminal handling, or last-mile transport.
Pricing changes quickly. Industry freight-rate reports show major differences between contracted and spot prices, especially on Asia–Europe and trans-Pacific routes. Buyers should request a full-cost sheet with currency, validity period, fuel adjustments, detention rules, and emergency fees. Ask for recent performance data, not optimistic promises. A cheap quote can be expensive.
Technology now separates basic coverage from dependable execution. The World Bank’s 2023 Logistics Performance Index highlights tracking, shipment timeliness, and logistics competence as important performance factors. Look for milestone alerts, electronic documents, container-condition updates, and accessible exception records. Useful systems should show a delayed vessel at 6:00 a.m., not after the warehouse misses production. Yet digital tools are not perfect. Data can lag, and automated estimates can mislead during port congestion. Buyers should test the platform with a real shipment, compare its timestamps with carrier records, and keep a human escalation contact.
Service Coverage, Pricing, and Technology Comparison
Selecting a container transport partner in 2026 requires more than comparing ocean freight rates. According to UNCTAD’s Review of Maritime Transport 2024, maritime shipping carries over 80% of global merchandise trade. Delays can therefore affect production schedules, warehouse space, and customer commitments. Ask each provider for recent performance data, including on-time delivery, rollover frequency, damage claims, and customs-document accuracy.
Reliability needs evidence. The World Bank’s Logistics Performance Index 2023 reports that international shipments can take about 44 days from entering the export port to reaching the destination. Choose a partner with clear milestone tracking, responsive exception alerts, and tested alternatives for congested ports. Request a sample shipment record. Check whether its promised transit time matches actual results.
Look beyond the cheapest quote. A useful comparison should include detention terms, port handling fees, insurance coverage, sustainability reporting, and escalation contacts. Smaller details matter: who answers at 2 a.m. when a container misses its connection? A low price may hide weak communication. That is easy to overlook. Some buyers also overvalue impressive dashboards while ignoring poor local coordination. Review the data quarterly, challenge unexplained delays, and revise the selection when performance repeatedly falls short.